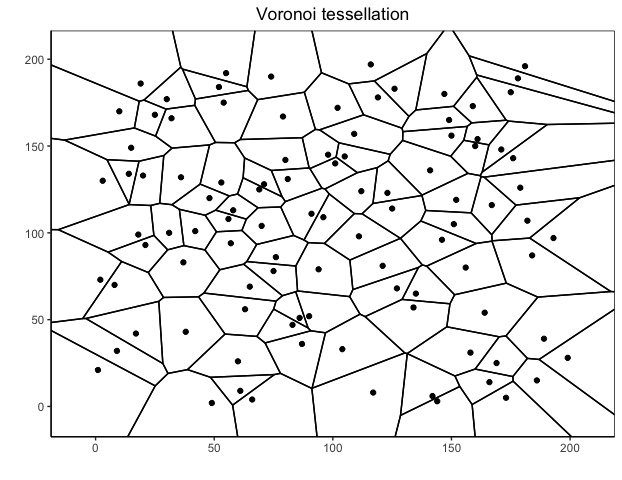
Voronoi tessellations result from k-Nearest Neighbors where k=1
In supervised statistical learning, a way of approaching a case where categorical training data results from a mixture of multiple low-variance Gaussian distributions (where individual means are themselves Gaussian-distributed) is via k-nearest neighbor modeling.
In particular, the \(k\)-nearest neighbor fit for \(\hat{Y}(x) = \frac{1}{k}\sum\limits_{x_i\in N_k(x)}{y_i}\), where \(N_k(x)\) is defined as the \(k\) points that exist in the neighborhood of \(x\).
Suppose that \(N_k(x)\) corresponds to those \(k\) points nearest to \(x\) for each \(x_i\) as defined by Euclidean distance. When \(k=1\), the resultant clusters can be mapped onto a two-dimensional diagram to show a Voronoi diagram!
# Voronoi diagram
library(ggvoronoi)

# Create data
x_coord <- sample(1:200, 100)
y_coord <- sample(1:200, 100)

# Define points
points <- data.frame(x_coord, y_coord)

ggplot(points,aes(x_coord,y_coord)) +
  labs(title="Voronoi tessellation", x="", y="") +
  theme_classic() +
  theme(plot.title = element_text(hjust = 0.5)) +
  scale_y_continuous(expand = c(0, 0)) +
  scale_x_continuous(expand = c(0, 0)) +
  stat_voronoi(geom="path") +
  geom_point()